

This project used comparative analysis of pathological visual depictions to help identify the significance of the evolution of the syphilis host-pathogen relationship. The creation of a chronological, visual, and interactive map of a disease's evolution may offer a tool that physicians and microbiologists can use to gain a better visual and predictive understanding of a disease's phenotype and progression across a population. The research widened the use of 3D modeling for retrospective case study and analysis by exploring a new method of qualitative-to-quantitative analysis.
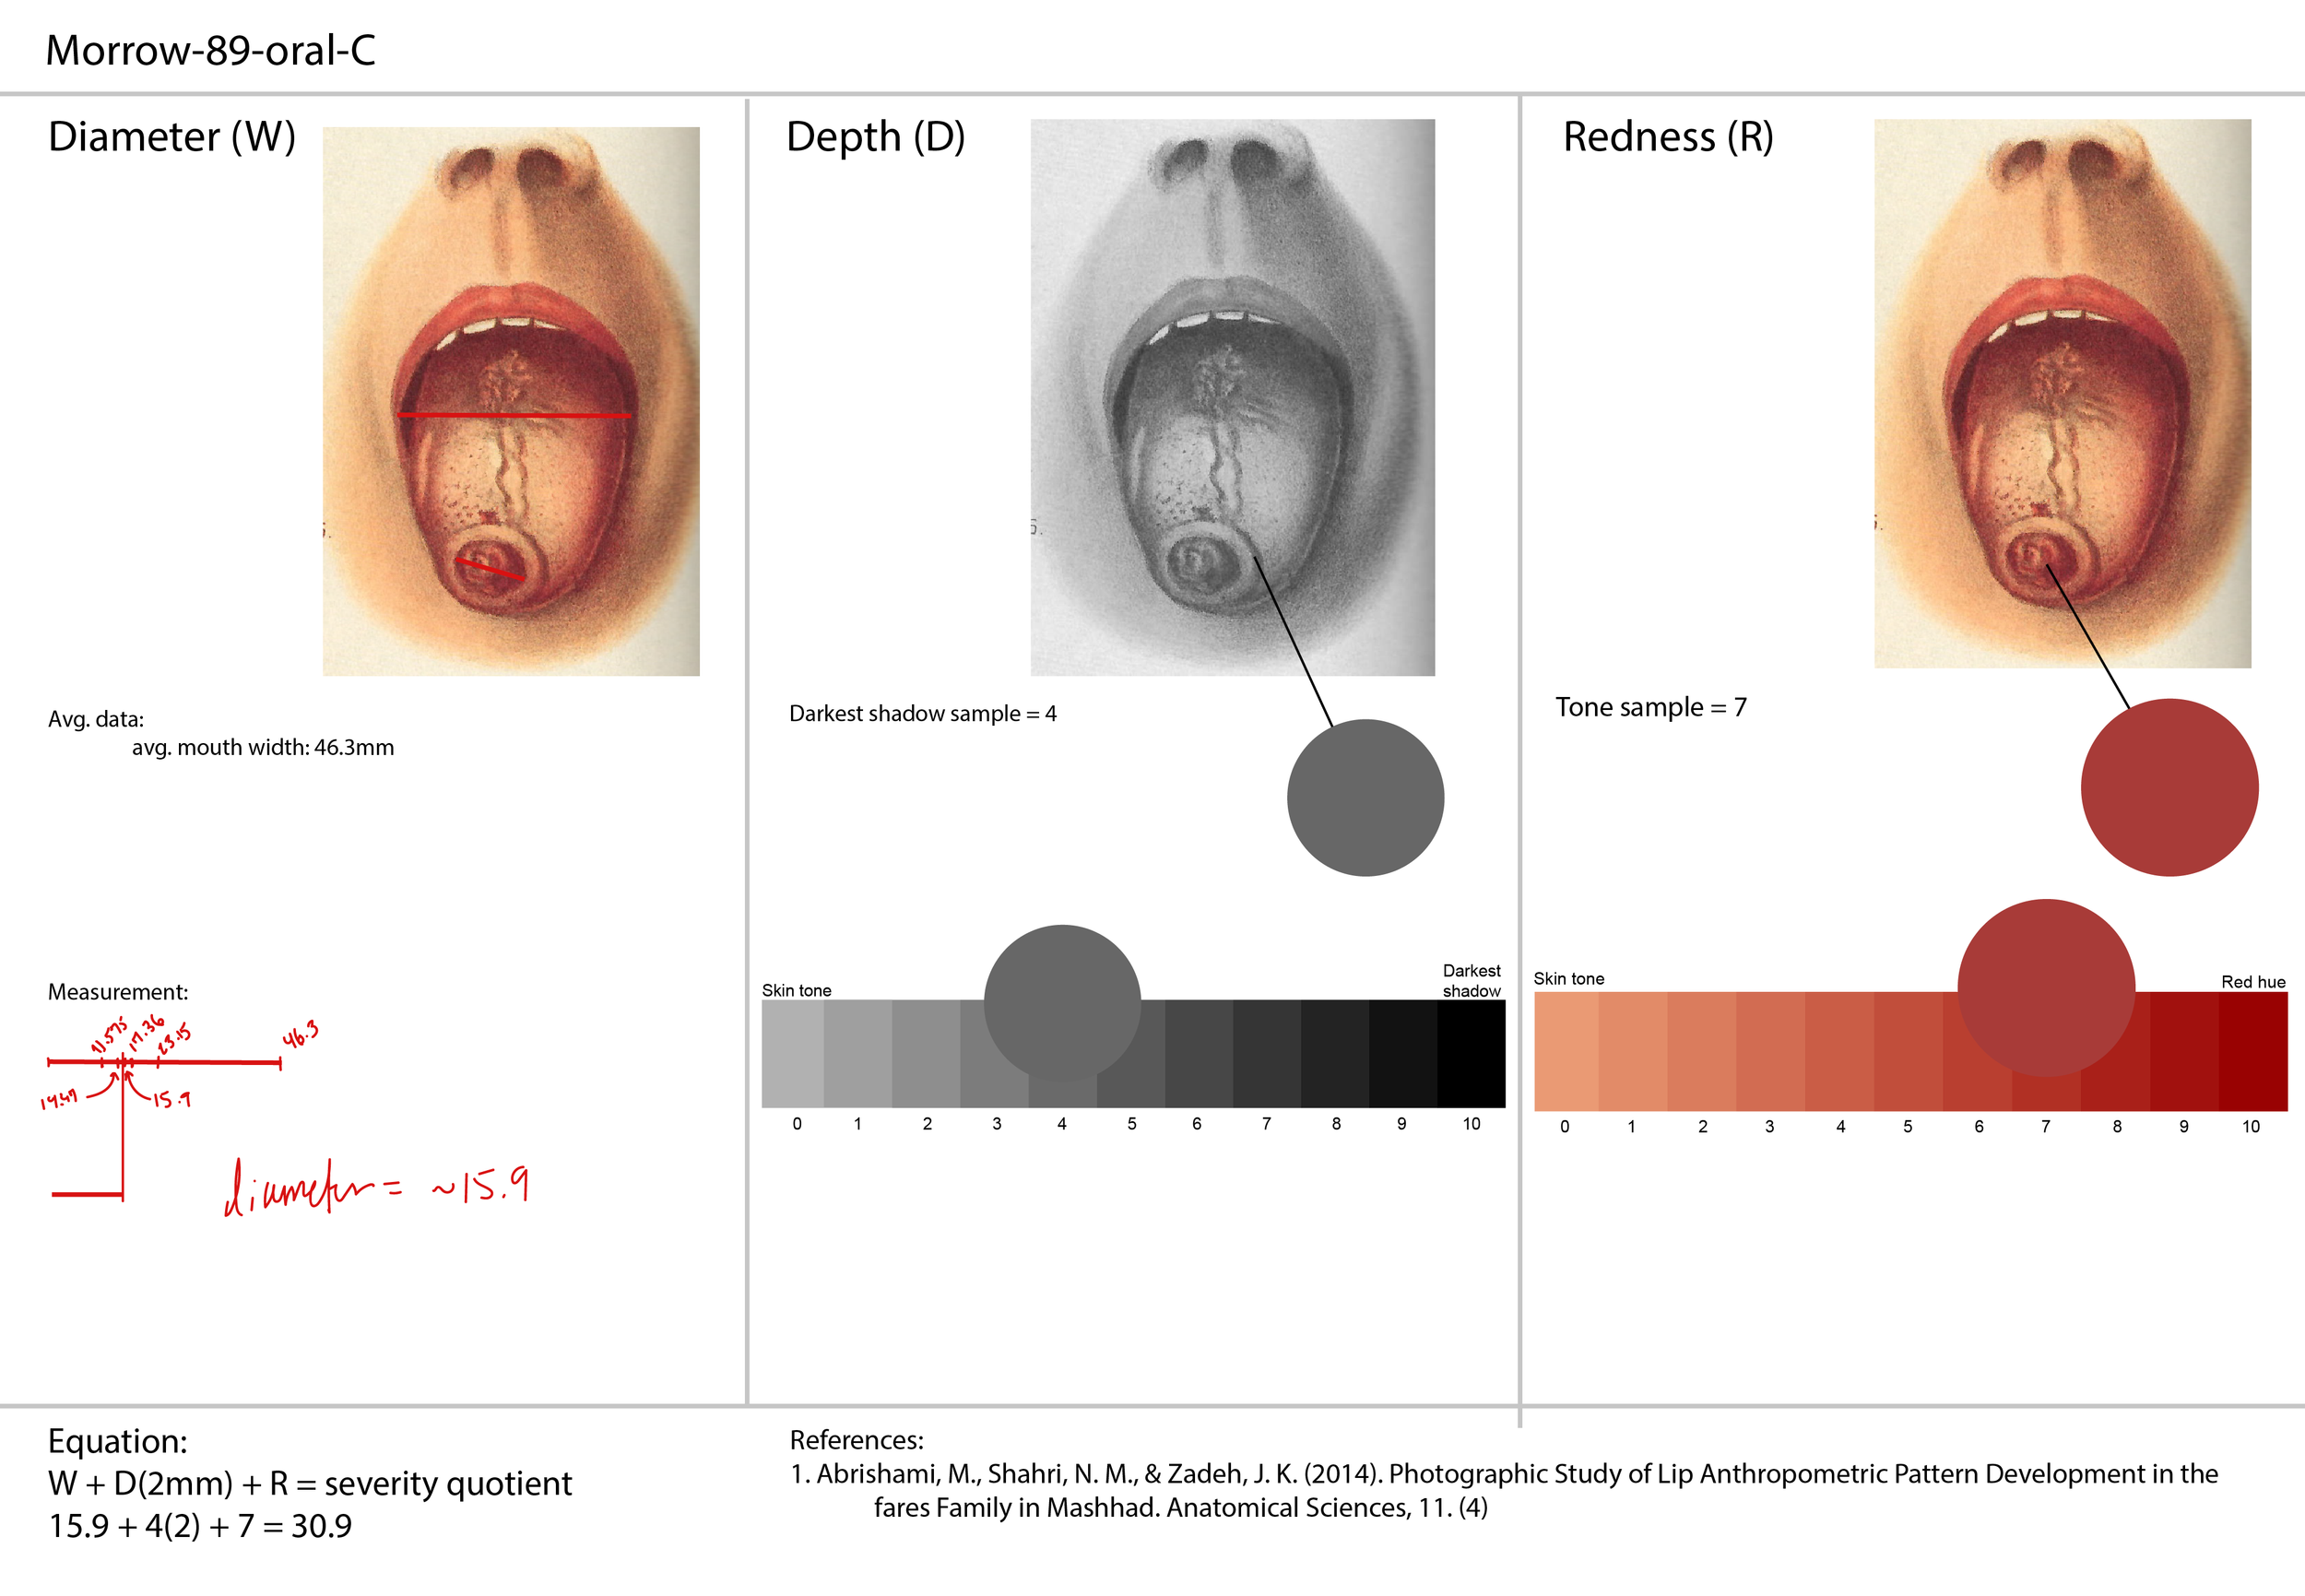
A survey of historical images of the syphilis primary chancre was conducted - this would be the pathognomonic, cutaneous focus of the project. These images, spanning from 1773 to 2019, would serve as case studies with visual information indicating the erythema, edema, and diameter.
An equation was developed, using each virulence indicator as a numeric value:
Width + Depth(2mm) + Redness = Virulence
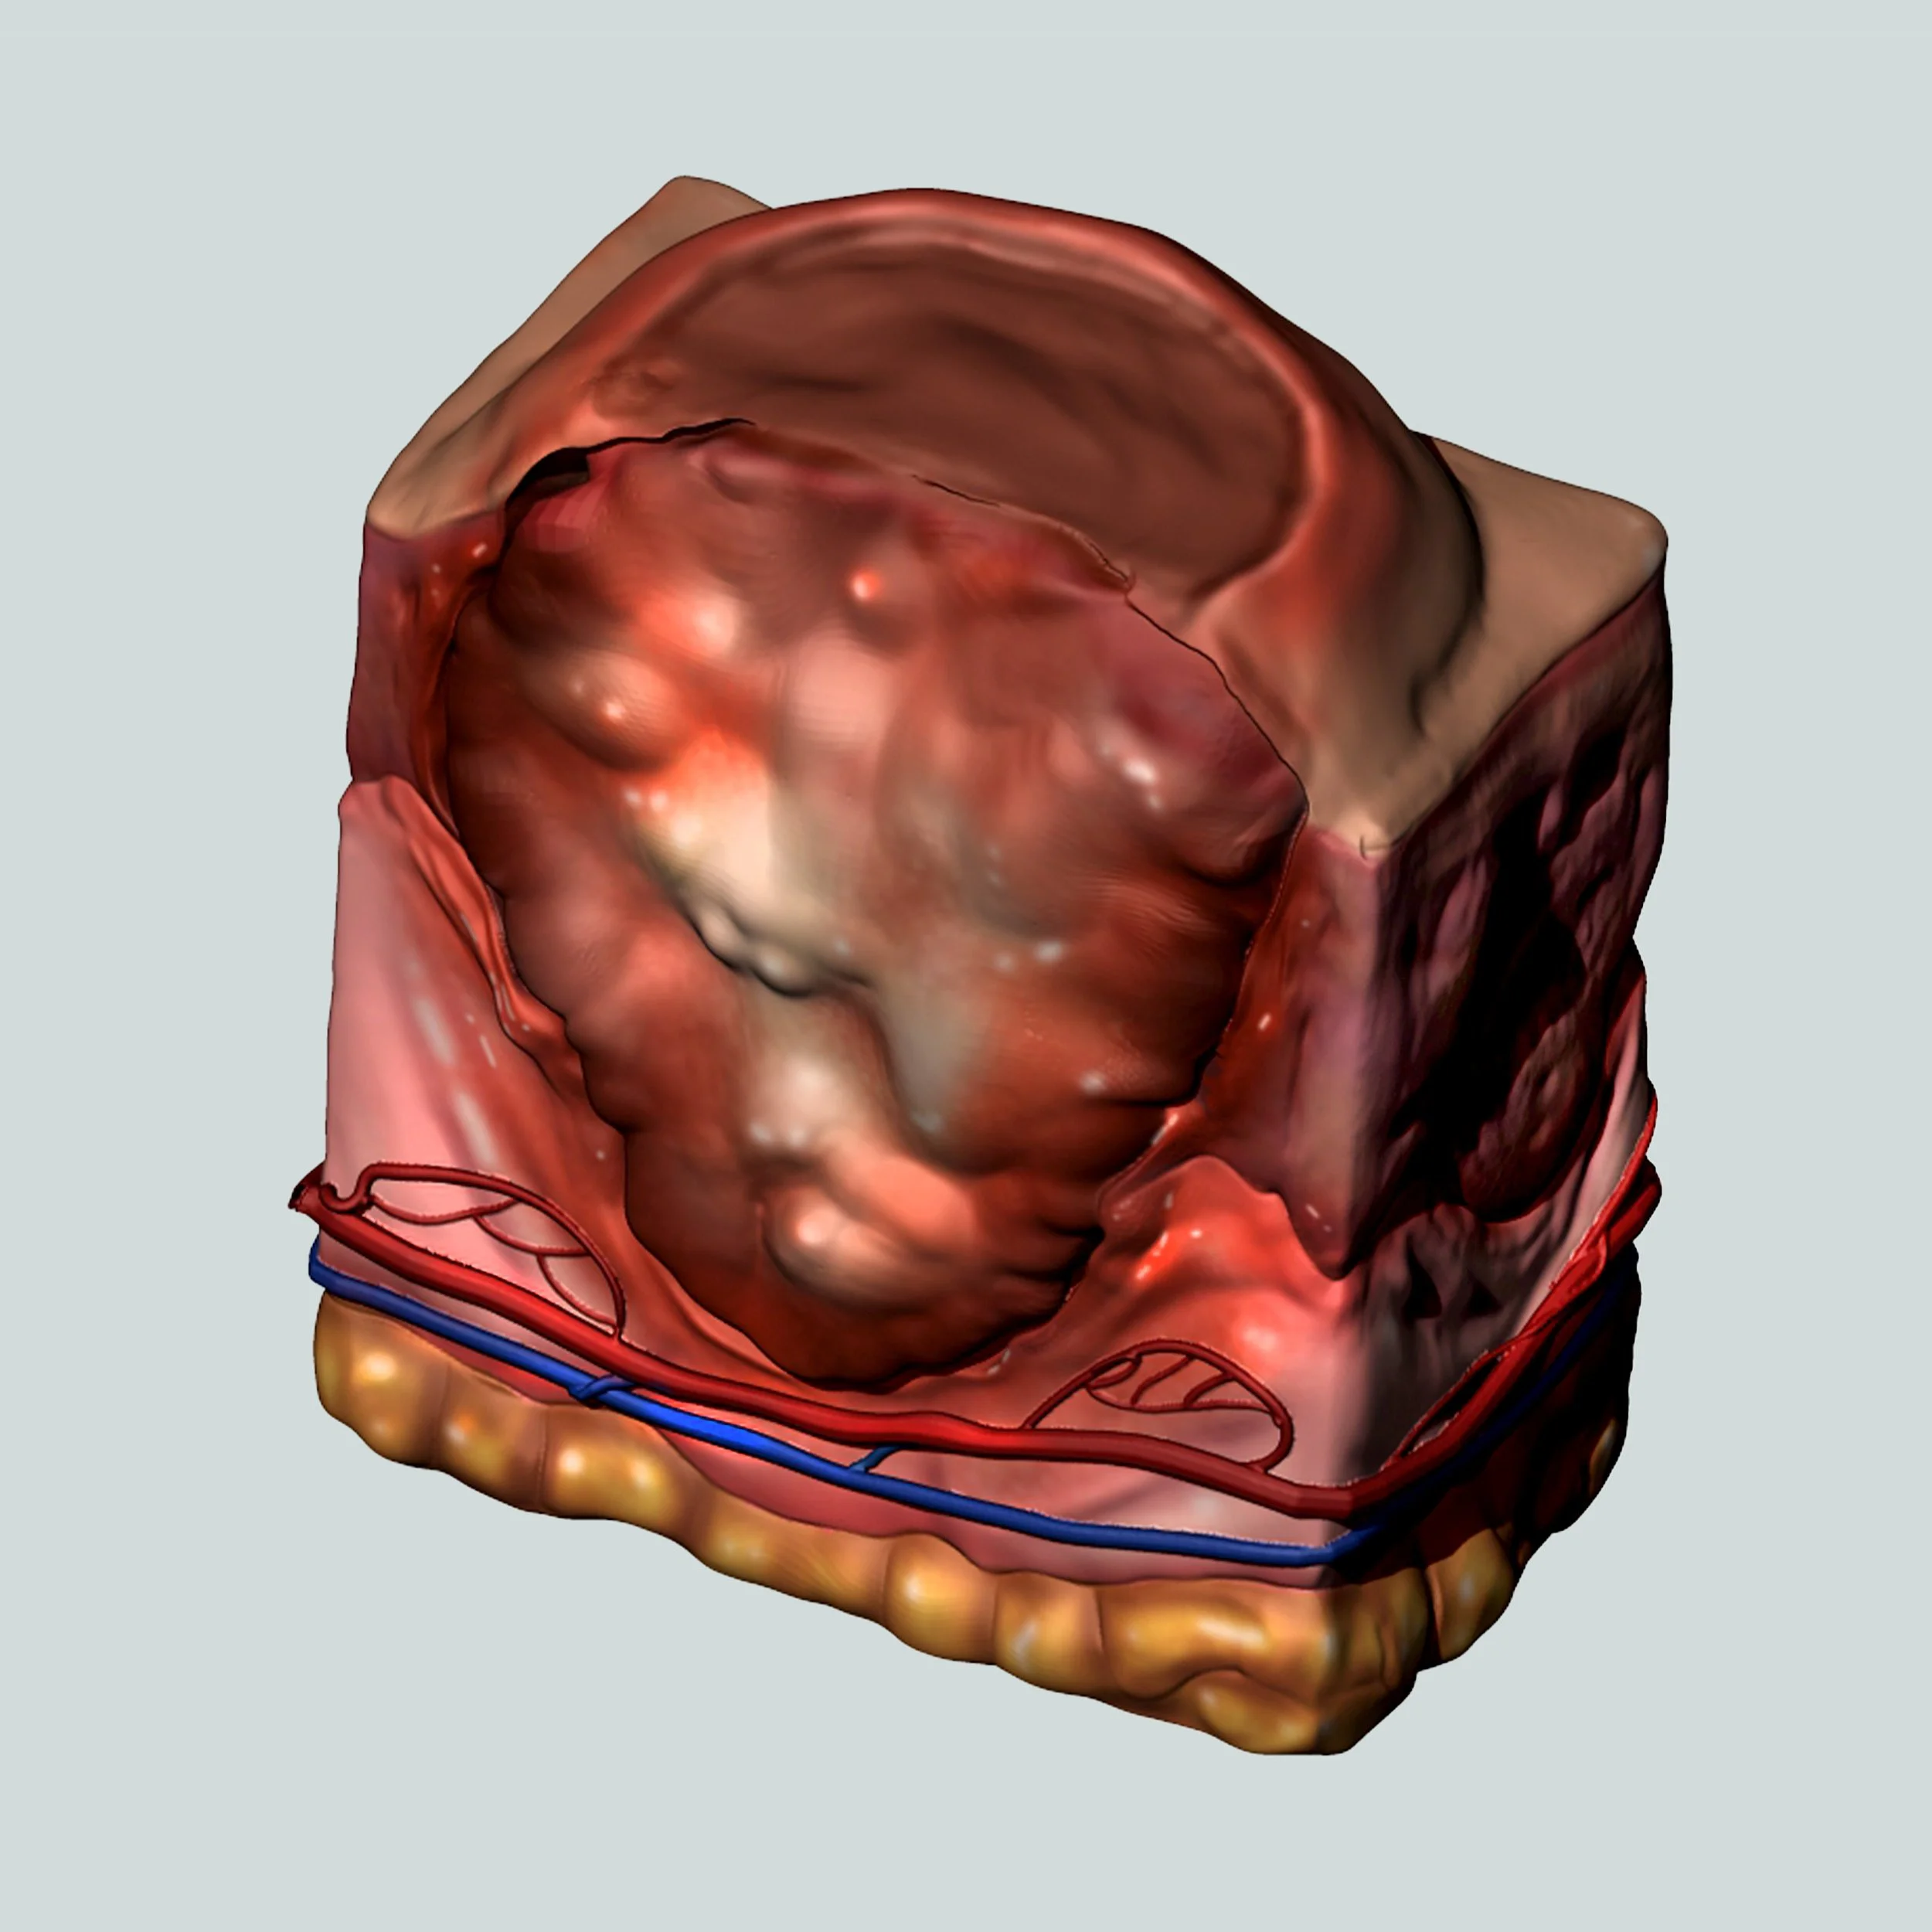
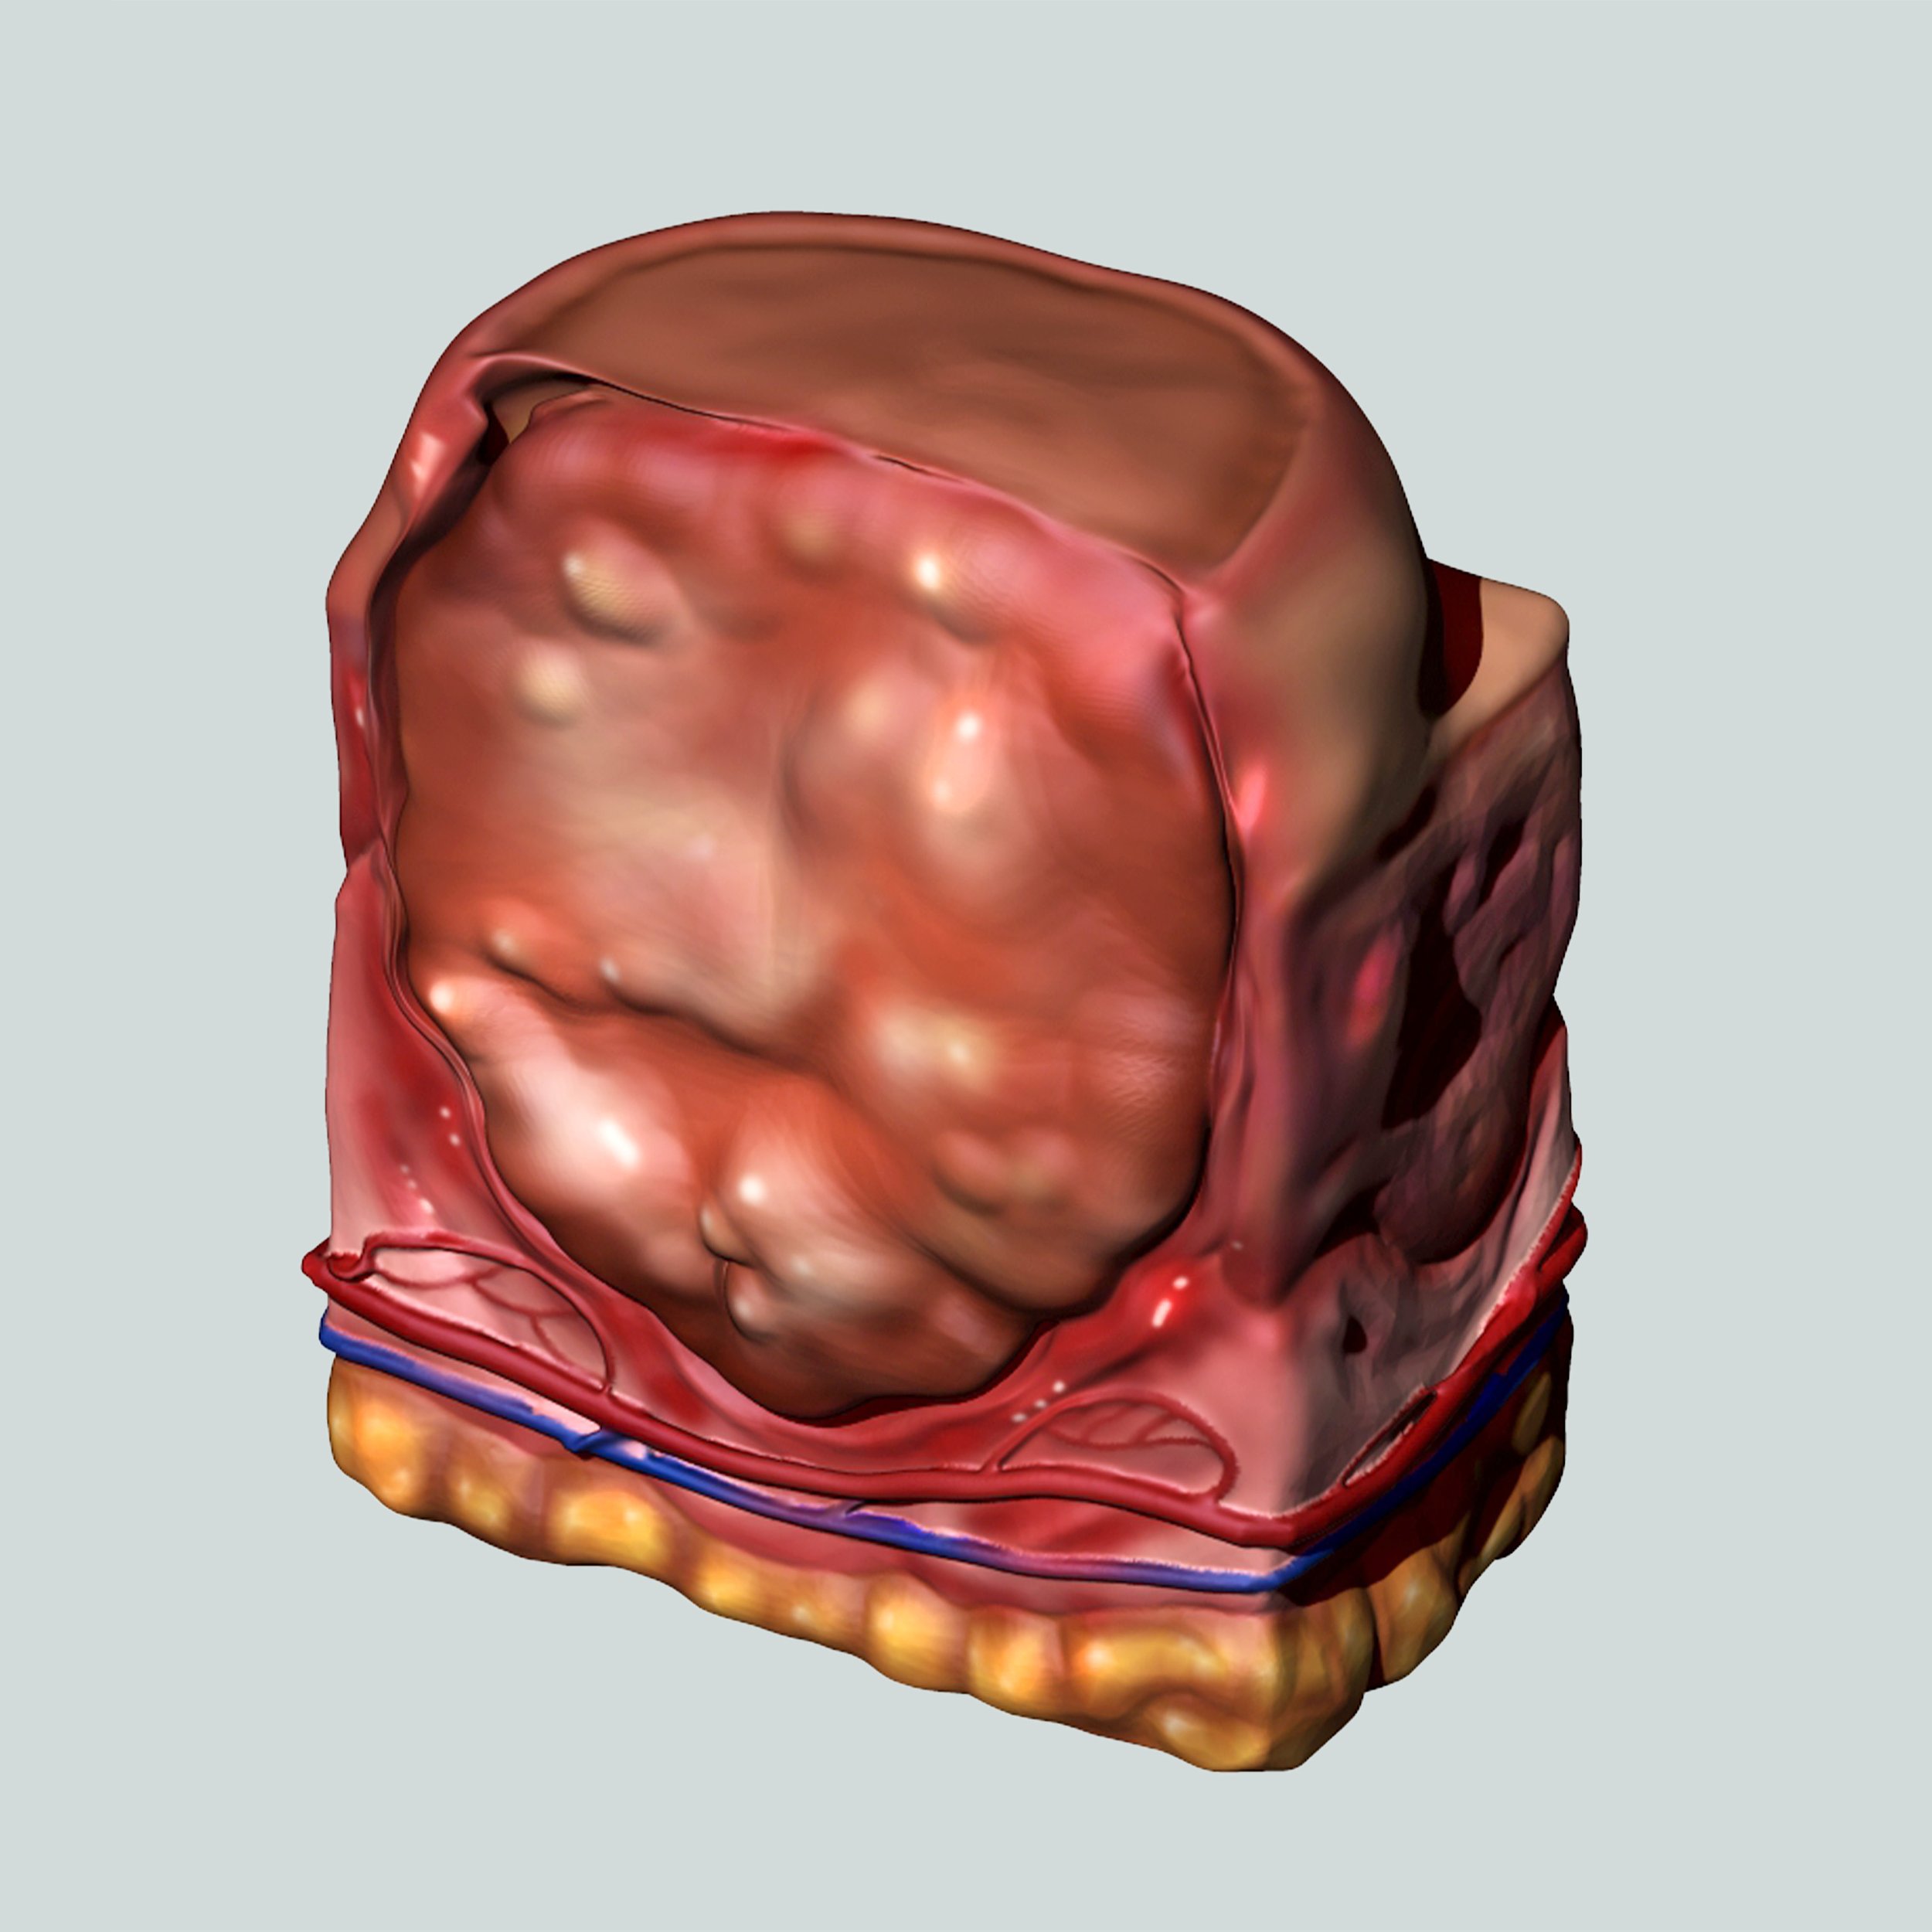
Once each case’s virulence was calculated, they were compared and used to determine the mean Gold Standard (GS) virulence value. These inputs were used to design and create 3D models that represented the GS for each observable century.

21st Century

20th Century
19th Century
18th Century
The results of this research project indicate that the qualitative-to-quantitative protocol used may be effective when applied to other disorders. Graphed results indicated a steep change in virulence upon entrance into the 21st century, replicating what is known about the disease’s response to widespread use of antibiotics. More research is necessary into the area of 3D paleopathological exploration.

Access to a rotatable Word document with the final deliverable is available below: